
When investing long-term into property one of the key barometers is that of rental income. The Office for National Statistics (ONS) has put together an experimental rental prices index for England. As you can see below, the graphs make interesting reading and indicate a number of emerging trends.
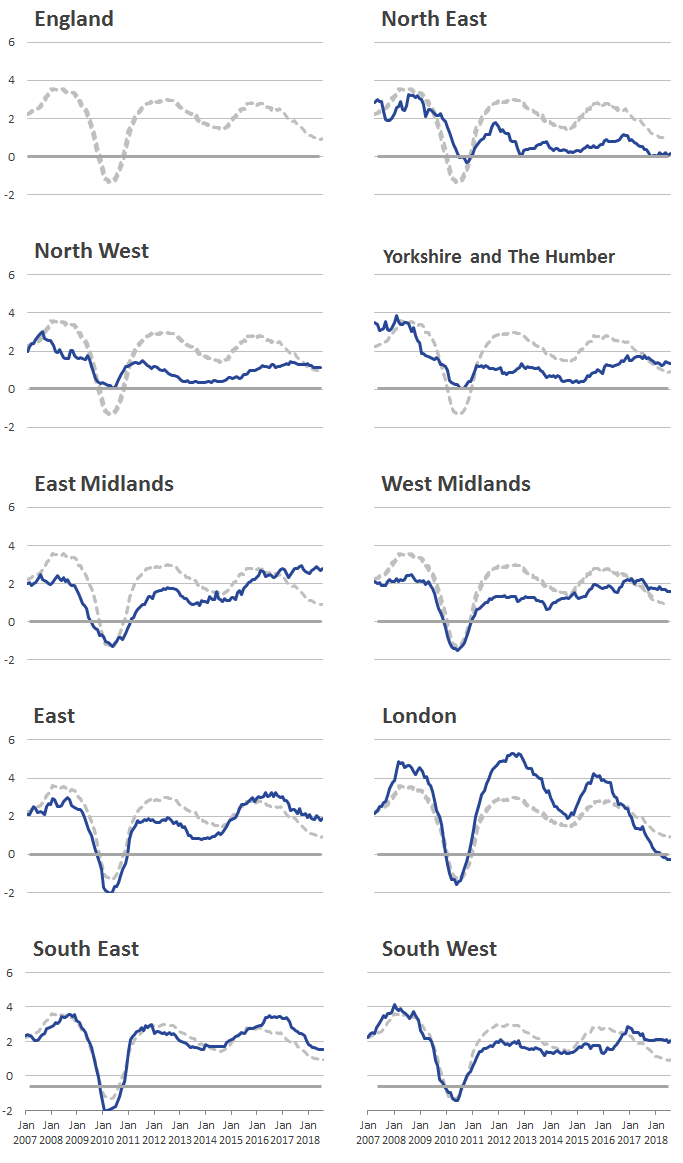
England
If we look back to 2007 rental charges were increasing by an average of 2% per annum although this did increase to around 3.5% during 2008. The US mortgage crisis brought about difficulties in the property market and an economic downturn. Rental charges softened hitting a low in 2010 when rental charges fell by just over 1%. As the recovery started, rental charges began to increase oscillating between an increase of just under 2% and 3% per annum between 2011 and 2017.
There has been a definite softening in rental charges in the aftermath of the Brexit vote back in 2016. Inflation in the UK is now running at around 2.7% per annum which means that the real value of rental income is falling.
North East of England
It is fair to say that the North East of England rental market has underperformed England as a whole in the aftermath of the 2008 economic collapse. Since 2010 annual rental income growth has peaked at around 1.9% but fallen to 0% in 2012 and more recently 2017 and 2018. In relative terms, recently it has outperformed England as a whole but this is little compensation for investors.
North West of England
Interestingly, rental income growth in the North West of England has remained fairly constant between 0.2% and 1.8% from 2010. In relative terms rental income growth has been outperforming the rest of England since around 2016. This would suggest that there is relatively strong demand for rental accommodation in the region.
Yorkshire and the Humber
In a similar fashion, but a slightly more volatile nature, the rental income increase in Yorkshire and the Humber is similar to the North West of England. As average rental income increases across England began to fall from 2016, rental income in Yorkshire and the Humber initially continued to rise and is now holding its own.
Provided by ONS
East Midlands
Between 2007 and 2015 rental growth in the East Midlands generally went in the same direction as the average increase for England. It is only since 2016 that we have seen significant relative outperformance with rental income increases holding between the 2% and 3% level. This compares favourably against a fall from 2% down to 1% across England as a whole.
West Midlands
In a similar fashion, the West Midlands began to outperform average rental increases in England since the Brexit vote of 2016. While the average annual increase for England currently stands at around 1% the West Midlands is currently flirting with the 2% level. It will be interesting to see whether this period of relative outperformance continues.
East
Rental income rises in the East of England have broadly tracked the trend for England as a whole. However, we have seen a degree of outperformance since 2015 with annual rent increases currently holding steady around 2% per annum. It will be interesting to see whether this holds up in light of the ongoing Brexit concerns and challenges for the UK economy.
London
The London rental market has broadly tracked the trend for the rest of the UK although since 2010 the peaks have been higher and the current trough lower. The latest data indicates that there is a significant softening in London rental prices now dipping into negative territory. It would appear an increase in London rental rates will not occur in the short term.
South East
Rental increases in the South East of England tracked almost exactly the average for England until 2015. There was a period of outperformance from mid-2016 to mid-2017 although recently rental increases seem to be tracking the England trend. Will we see further relative softening in the short to medium term?
South West
The graph shows that rental increases tracked the England average from 2007 through the collapse of 2008 and the bottom which occurred in 2010. We then saw a relatively steady performance, missing out the two peaks of 2012 and 2016, before the market began to recover. Between 2016 and 2017 there was significant outperformance against the average with rental increases stabilising at around 2% to date.
Conclusion
This experimental index produced by the ONS offers a very interesting insight into rental increases across England and local property markets. It is no surprise to see softening in London and the South East but some may be surprised at the relative outperformance of other areas of the country. Will this prompt a shift in investment patterns?